
As reported on November 19, 2026, Grayscale Research put Bitcoin’s one-year realized volatility at about 43%, down from roughly 64% ten years earlier and 81% five years earlier. Its comparison places that figure below the volatility of about 19% of S&P 500 constituents. The question is whether a less volatile Bitcoin is also a less risky holding.
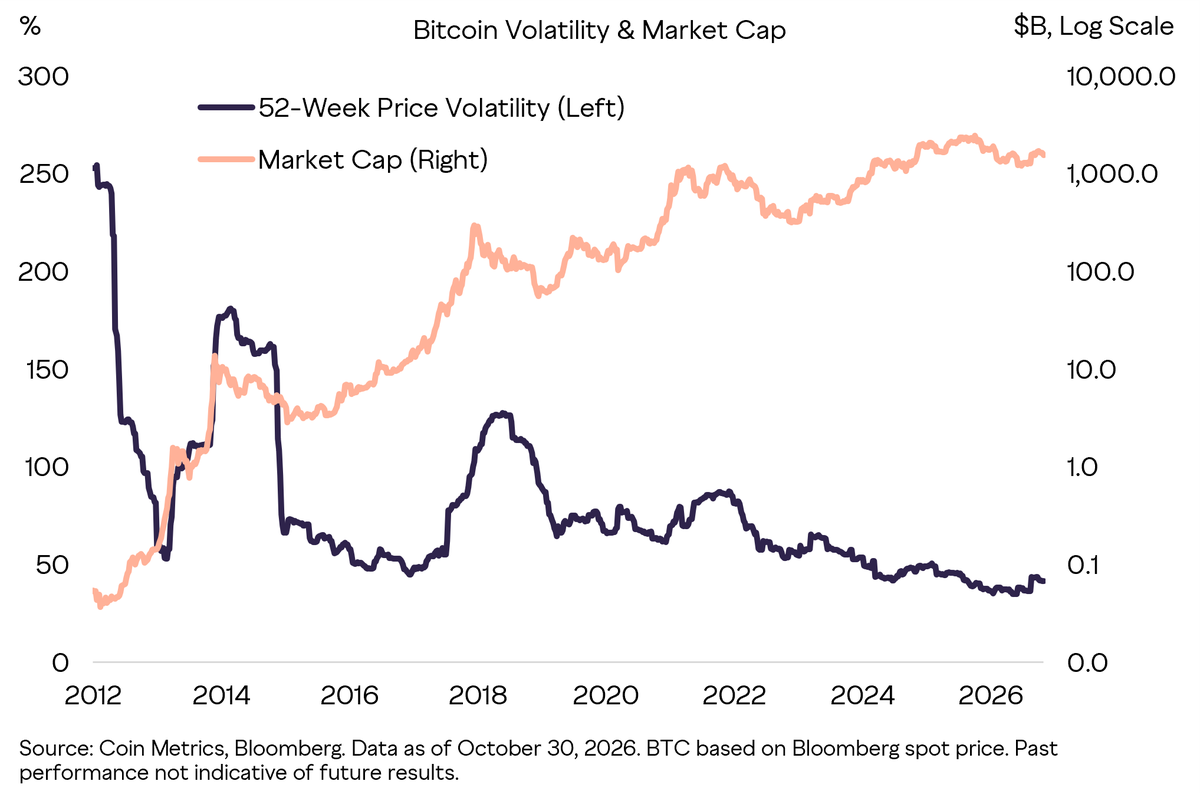
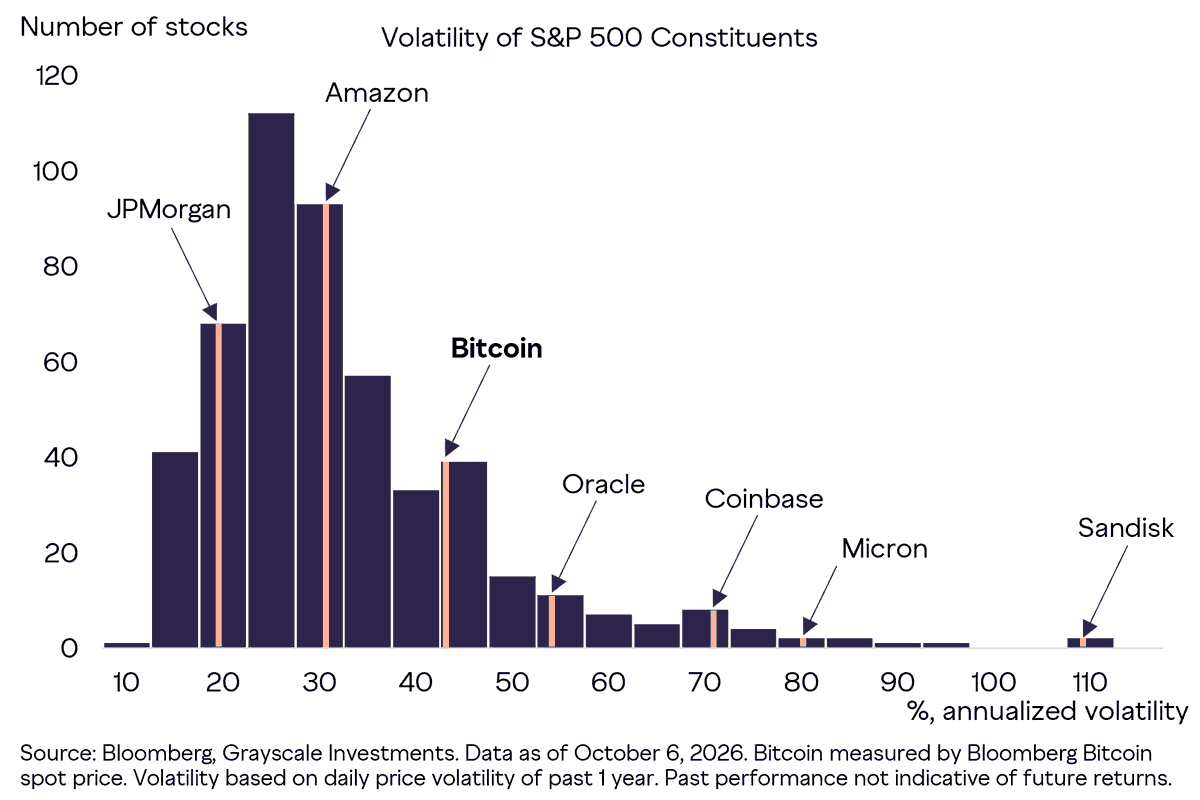
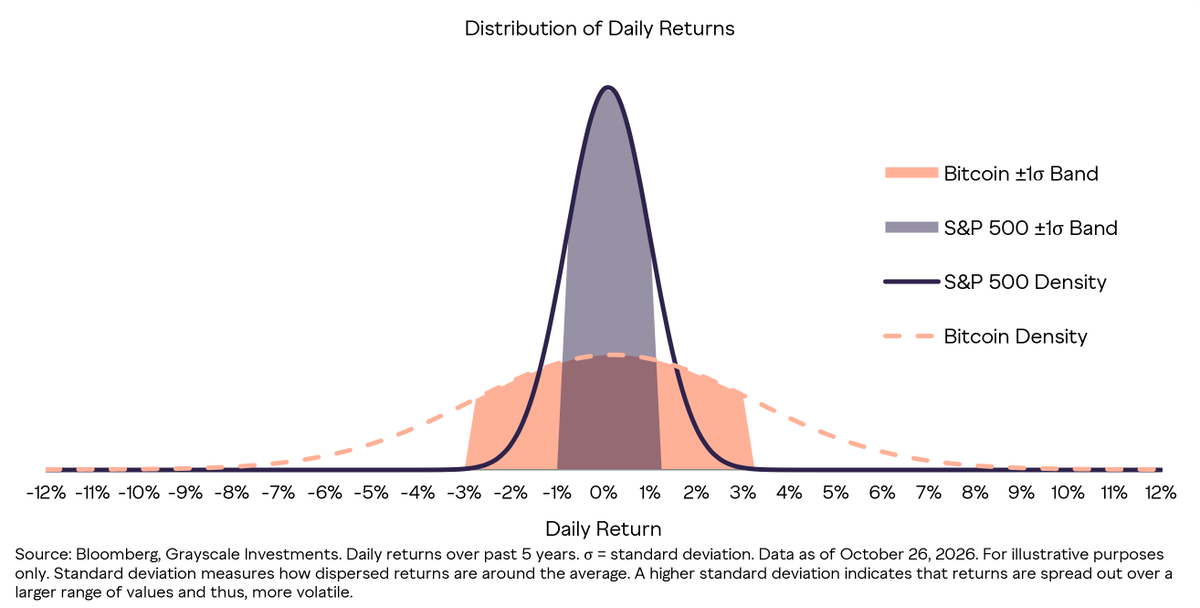
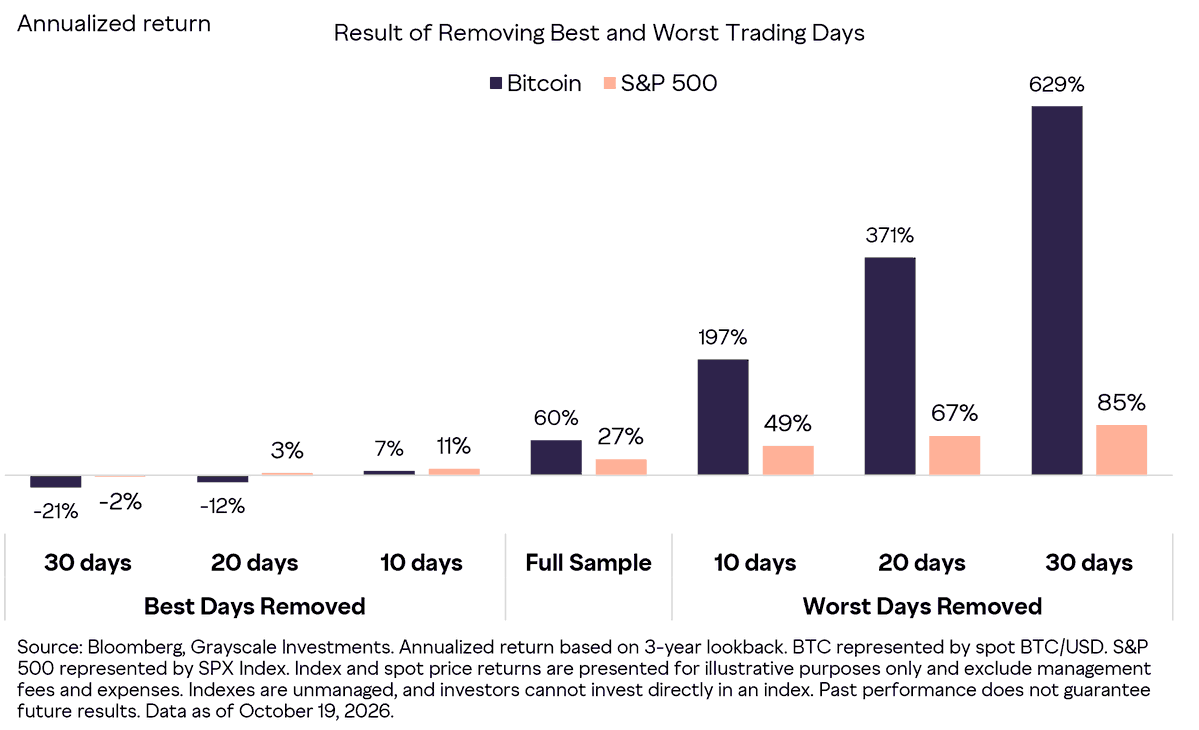
Not necessarily. Realized volatility measures how much an asset’s price moved over a past period. It does not describe every possible loss: Bitcoin has experienced multiple historical drawdowns exceeding 50%. A one-year volatility figure also cannot establish that the decline will persist.
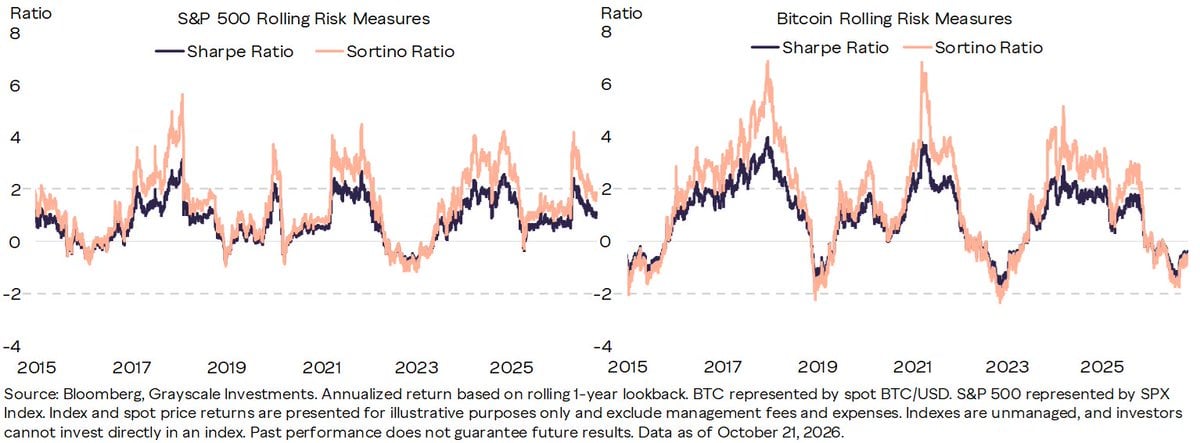
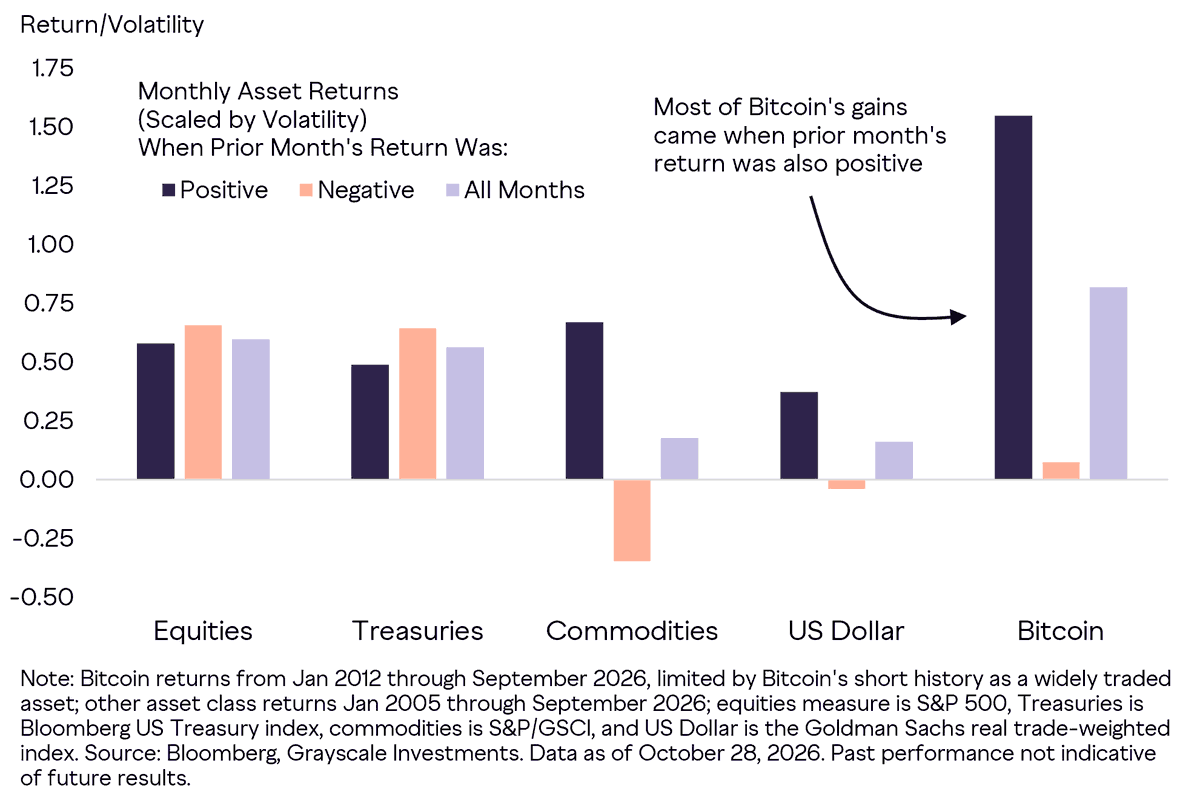
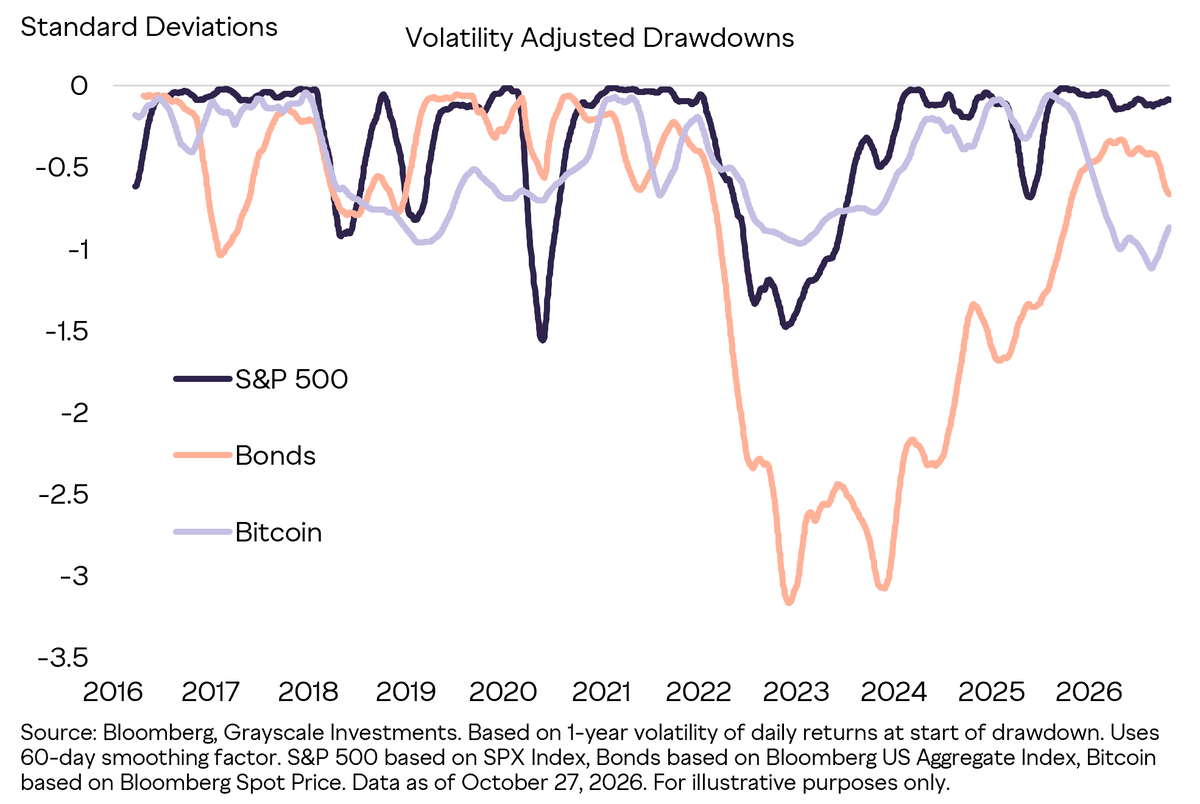
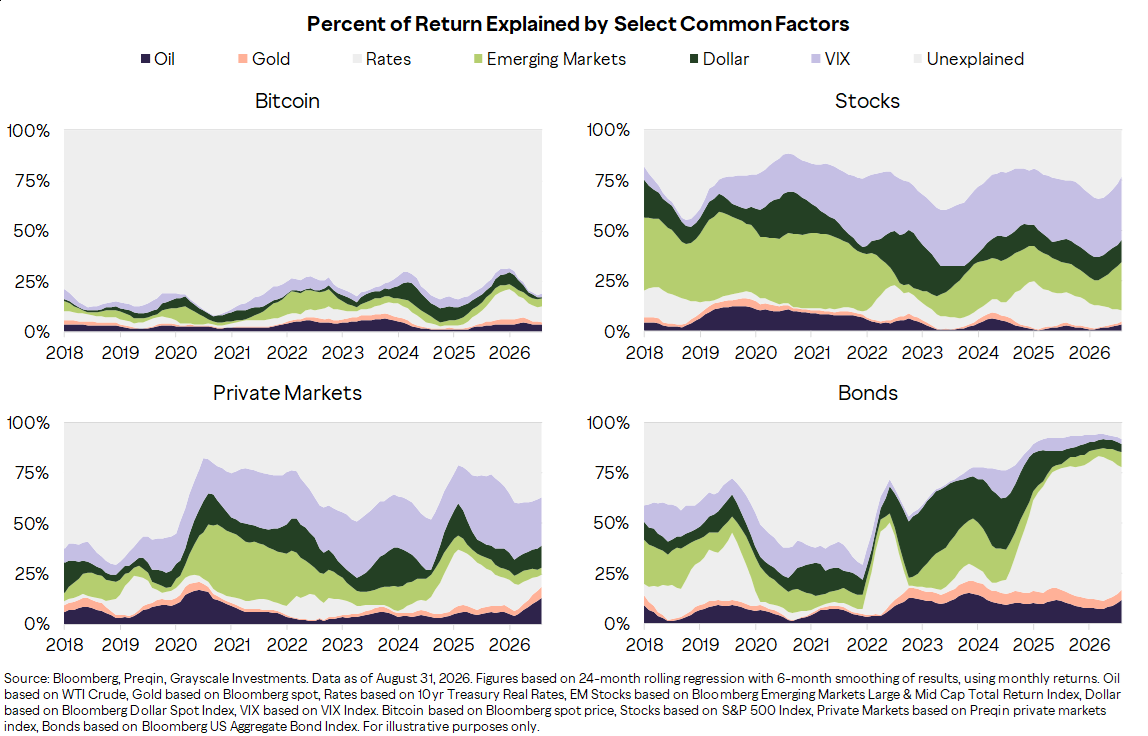
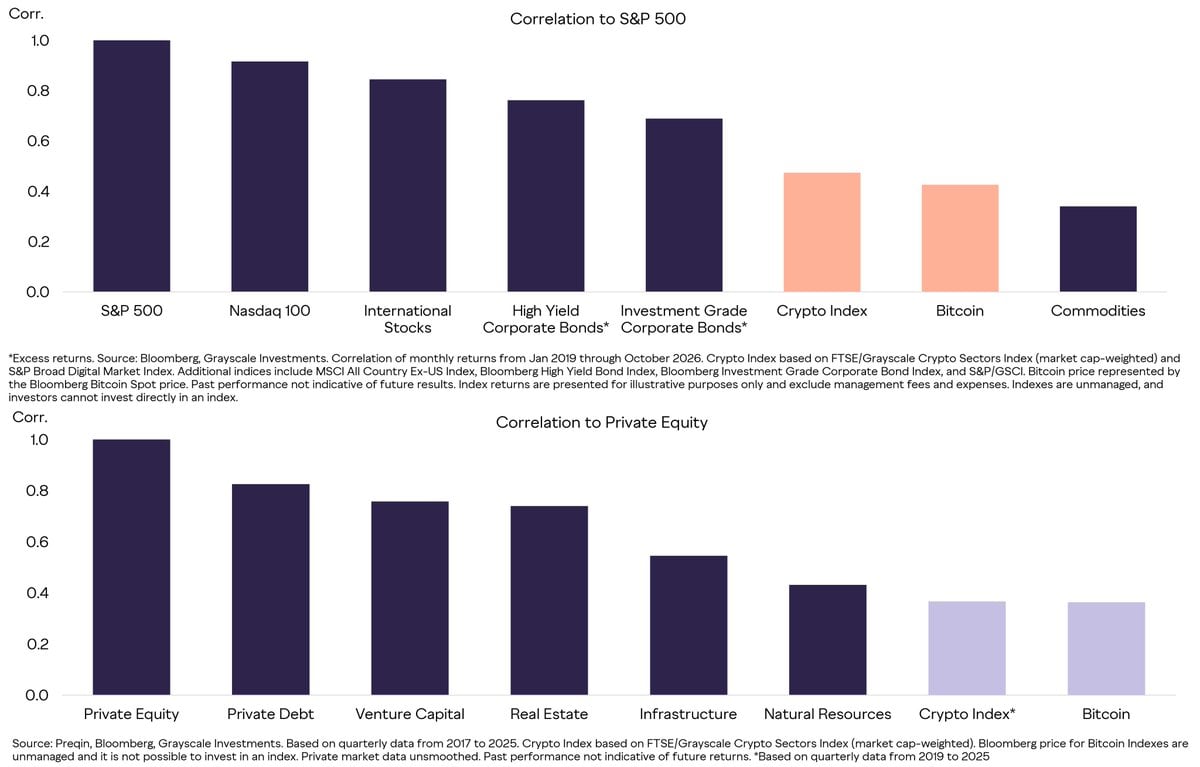
For a portfolio, the distinction is between Bitcoin’s own price swings and how those swings affect the holdings around it. Grayscale argues that traditional macroeconomic factors explain less of Bitcoin’s returns than they do for stocks and that its historically lower correlations can offer diversification. In Grayscale’s backtests, adding a 1%–5% Bitcoin allocation to a 60/40 stock-and-bond portfolio improved the Sharpe ratio across the macroeconomic periods it examined without substantially worsening maximum drawdown.
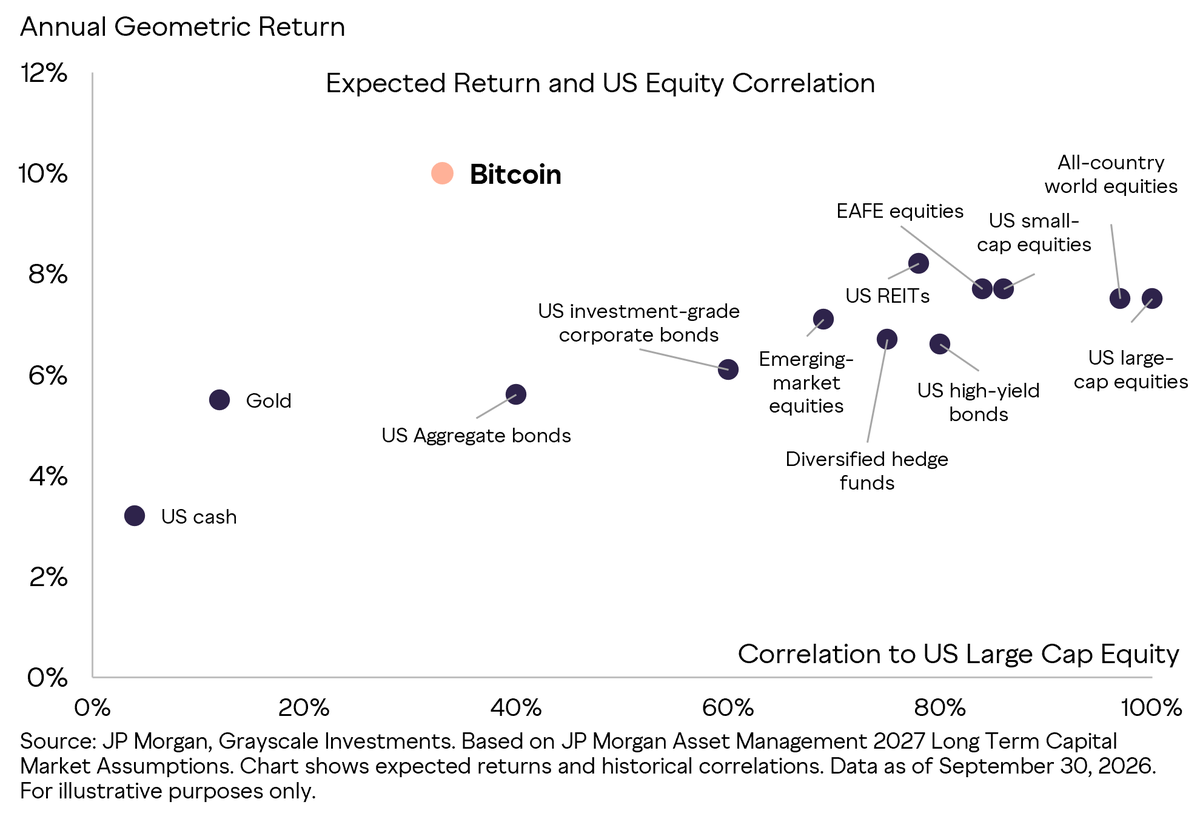
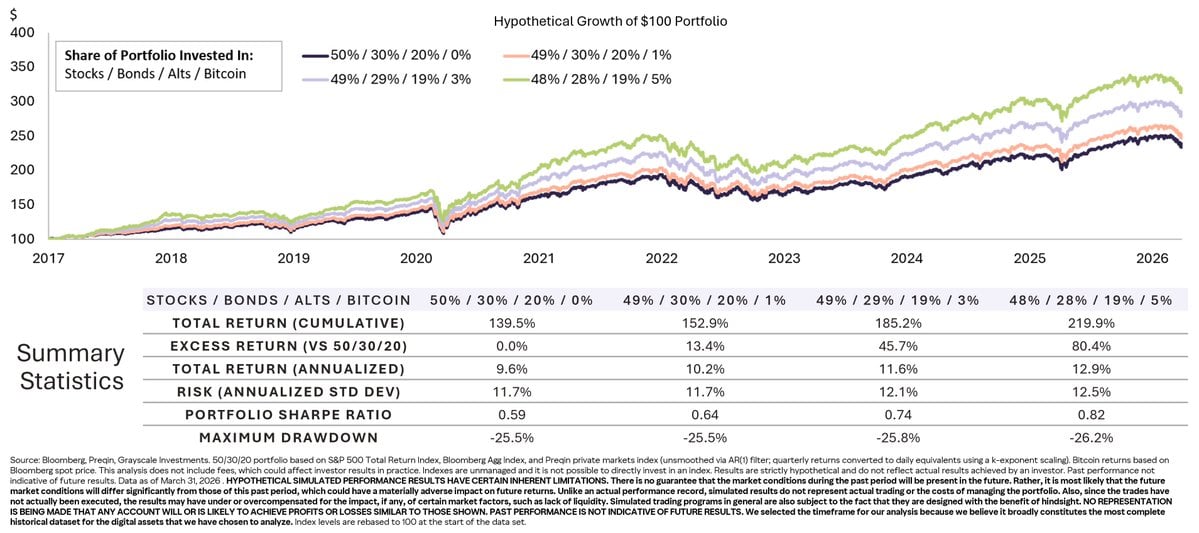
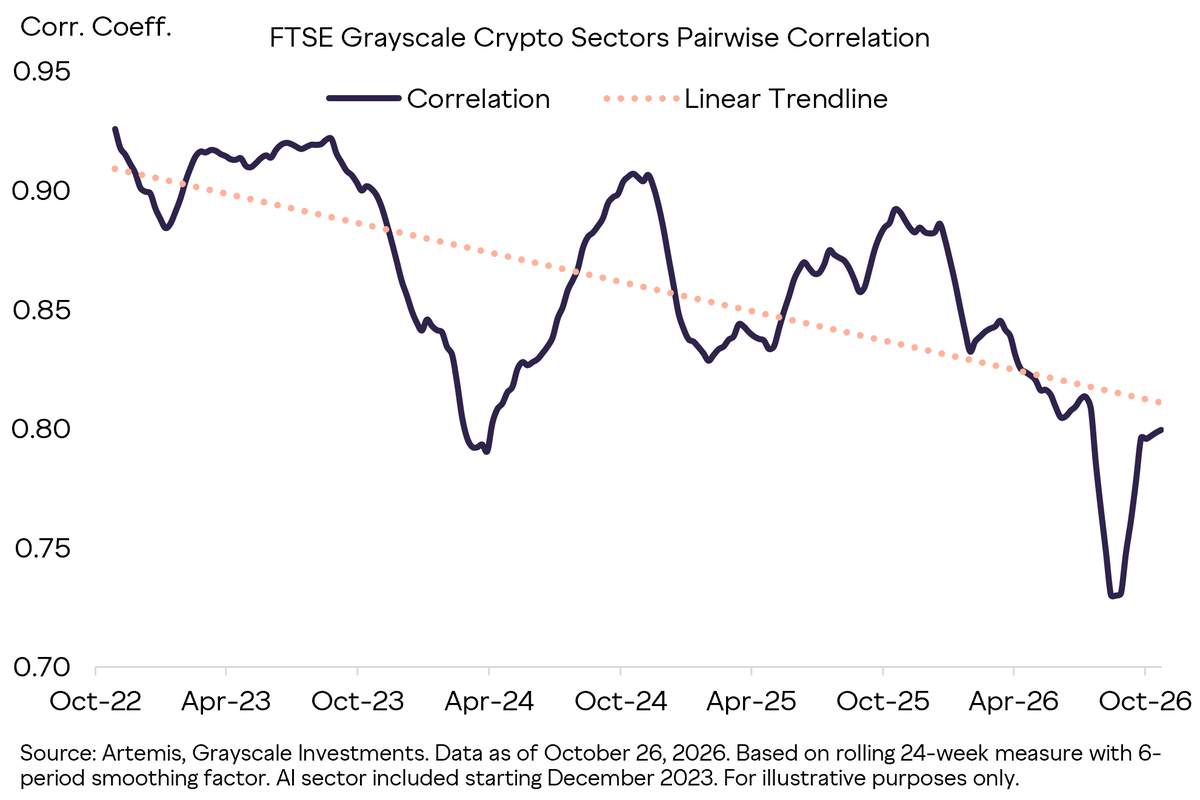
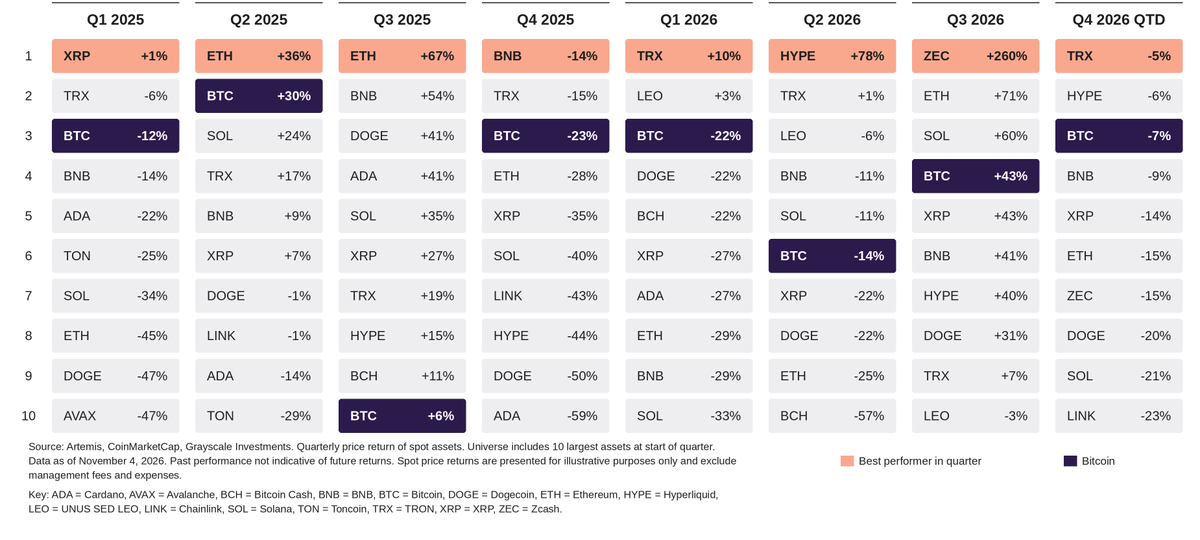
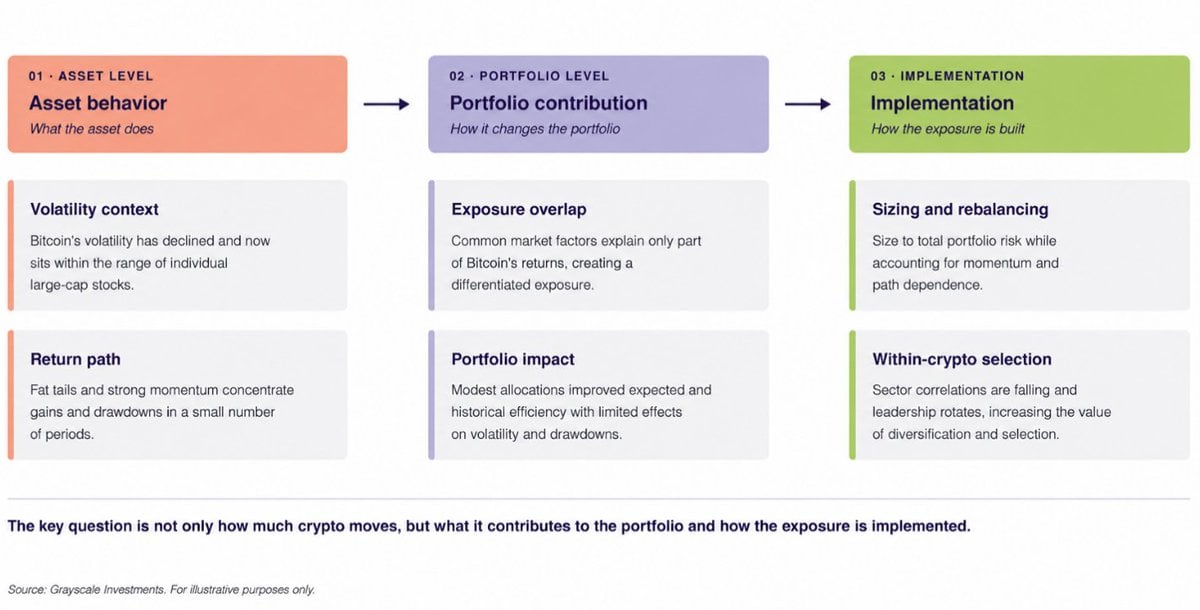
Those are model results, not a promise about future portfolios. Correlations can change, and a smaller measured allocation does not erase the possibility of a deep Bitcoin drawdown. The 43% figure is useful evidence about past price movement; it is not, on its own, a complete measure of risk.