In a November 20, 2026 report, Material Indicators co-founder Keith Alan pointed to a resemblance between Bitcoin’s moving averages and a pattern seen in 2023. His caution matters as much as the comparison: one historical example is not enough to establish a reliable pattern.
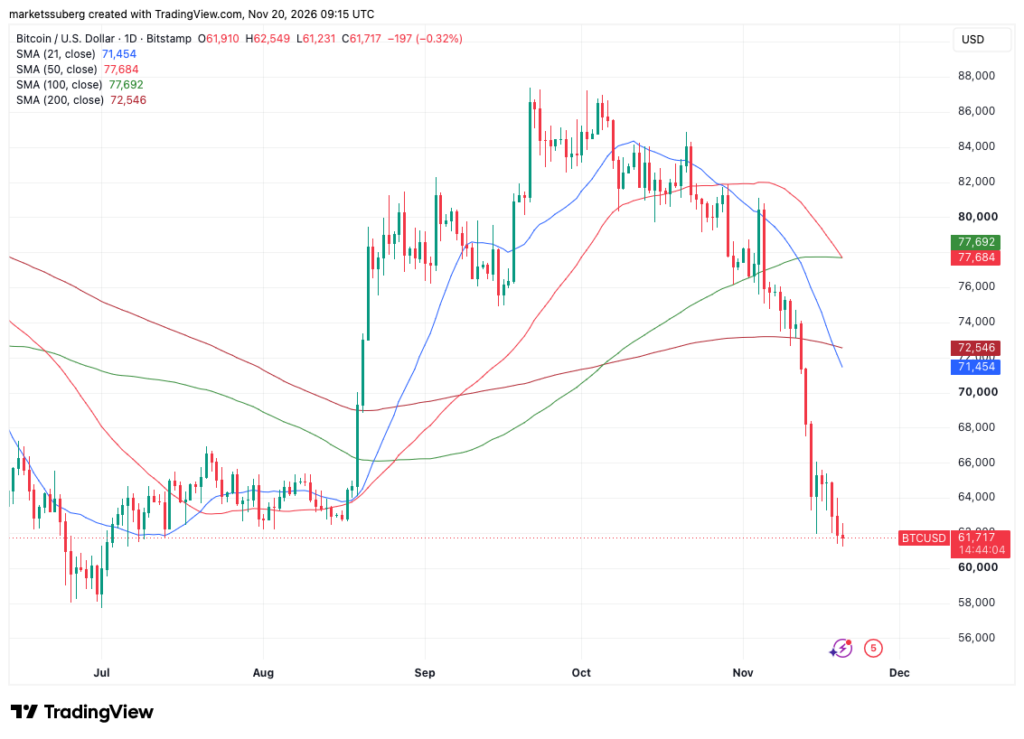
Alan said Bitcoin’s 21-day simple moving average had crossed below its 200-day average. In an analysis on November 19, he also expected the 50-day average to cross below the 100-day average before the end of that week. A Bitstamp daily-chart snapshot at 17:15 Beijing time on November 20 showed the 50-day average at about $77,684, just below the 100-day average at $77,692.
Similar pairs of crosses appeared in August and September 2023. Bitcoin subsequently retested support near $25,000 on September 11 of that year. Alan said the timing, position and candlestick features of the two periods looked similar, but stressed that the earlier episode does not justify expecting a comparable price move this time.